


Yeah. Stale. Here is why.

$66.7B in Equity.
$344B in Assets with $277B in Liabilities.
This equates to roughly $3 trillion in assets for $67 billion in equity. Of those assets, about $87B is in marketable non-current assets, about half of which are “corporate debt securities.” I tried to get more info out of that category in other filings to no avail. Perhaps others will have better luck.


The Price-to-Book (P/B) ratio is 47.15.
Book value per share has decreased by -7.3% year-over-year and has a compound annual growth rate (CAGR) of -2.7% across the last five years, resulting in a 1-year PBG ratio of -6.45 and a 5-year PBG ratio of -17.25.
Negative book growth.
SALES


The Price-to-Sales (P/S) ratio stands at 8.10.
Sales per share has shown a year-over-year growth of 5.3% and a compound annual growth rate (CAGR) of 12.1% over the past five years, leading to a 1-year PSG ratio of 1.52 and a 5-year PSG ratio of 0.67.
Respectable 5-year view.
Earnings
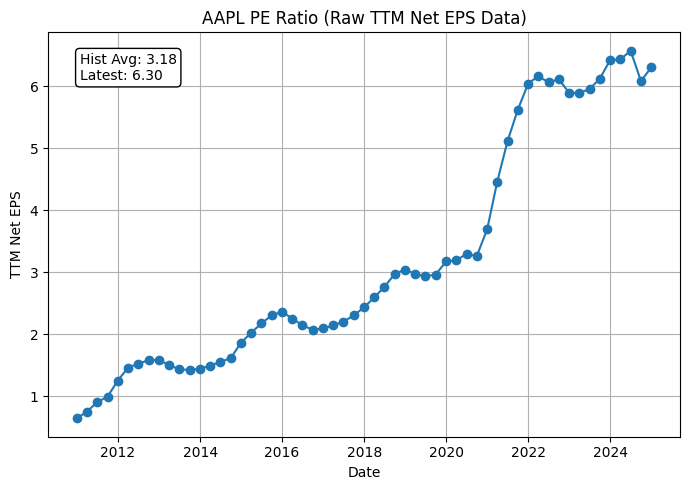

The Price-to-Earnings (P/E) ratio is currently 33.22.
Earnings Per Share (EPS) has demonstrated a decline of -1.9% over the past year and a compound annual growth rate (CAGR) of 14.7% across the last five years, resulting in a 1-year PEG ratio of -17.77 and a 5-year PEG ratio of 2.26.
Overpriced earnings growth.
Free Cash Flow


The shares are trading at a multiple of 32.52 times Free Cash Flow (FCF).
FCF per share has experienced a decline of -5.4% in the last year and a compound annual growth rate (CAGR) of 12.7% over the past five years, yielding a 1-year PFCF-growth multiple of -5.99 and a 5-year PFCF-growth multiple of 2.56.
Overpriced growth in FCF.
Combined Plots


A return to a 25 P/E would put AAPL around 160. A decline of 24% and to have its growth return to an undervalued status would be a price of 94. A long way to fall.
To recap:
Valuation Ratios for AAPL:
• P/E Ratio: 33.22
• P/S Ratio: 8.10
• P/B Ratio: 47.15
• P/FCF Ratio: 32.52
Earnings-per-Share – YoY: -1.87% | 5-Y CAGR: 14.72%
Sales-per-Share – YoY: 5.34% | 5-Y CAGR: 12.06%
Free-Cash-Flow/share – YoY: -5.43% | 5-Y CAGR: 12.71%
Book-Value/share – YoY: -7.31% | 5-Y CAGR: -2.73%
Recap of key growth ratios for AAPL:
• 1Y PEG: -17.772700 5Y PEG: 2.257092
• 1Y PSG: 1.515504 5Y PSG: 0.671781
• 1Y PFCFG: -5.985438 5Y PFCFG: 2.558995
• 1Y PBG: -6.452814 5Y PBG: -17.254902