


I Scanned 8 Thousand Tickers...
For NCAVs

I grabbed as many tickers as I could from Thinkorswim, and if they had a filing with the SEC in the last two years, they were parsed.

From about 8622 tickers passed though about half had a SEC filing within the last year. When I inevitably miss one that gets pointed out in the comments, all I can say is: I tried.
Definitions
NCAV, for this list, is defined as:
Market cap < Current assets – Total liabilities
Yes, there are other assets real estate, factories, long-term holdings that could make some companies undervalued by other standards. But we’re focusing on NCAV as the most stringent version of a cigar butt. Sorry to all the KSS shareholders.
Criteria
It wasn't enough to simply find piles of money. The second part—the part I hope to provide here is an argument that these are not simply melting ice cubes or dollar furnaces. These are companies still ticking.
If you just want the list:
IOR, KTCC, TLF, TRT, JCTC, INBP
Some are iffy. They won’t look like great companies
IOR

111.7M in Notes Receivable
75M Market Cap Vs 111.7M in Current Assets.
32% discount.
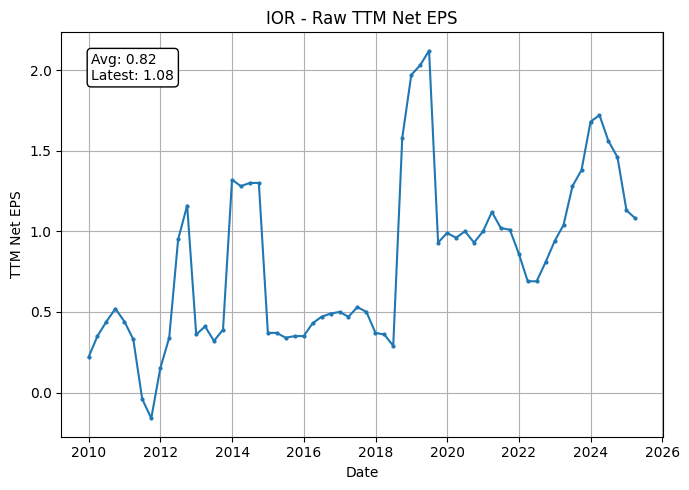
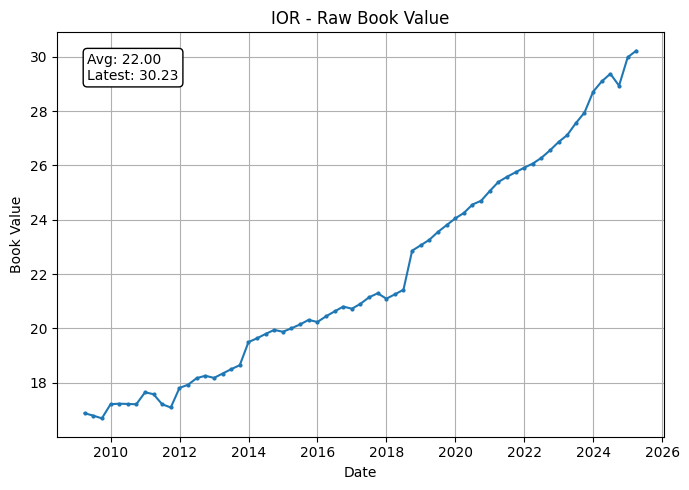


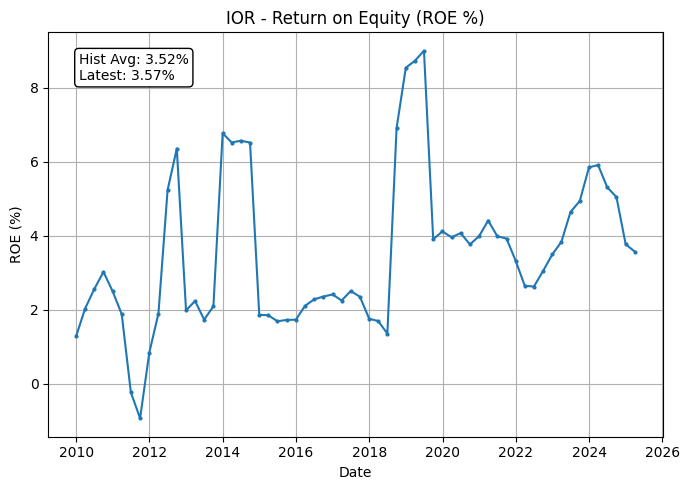
Good News: Its profitable, FCFs are mostly positive, and book value keeps going up and to the right.
Bad News: Like I said these are not going to be pretty. IOR Makes money has no sales due to the fact that they exclusively bet on “notes receivable that are collateralized by investments in land and/or multifamily properties. These investments have included notes receivable from Unified Housing Foundation, Inc. and other real estate mortgage notes.” Additionally, there is very VERY little public float available considering that Transcontinental Realty Investors, Inc. (TCI) owns over 80% of IOR's common stock with another 10% held by another company.
Well that is one. Onto the next.
KTCC

252M in Current Assets
208M in Total Liabilities
44M in Net Current Assets
32M in Market Cap
27% Discount


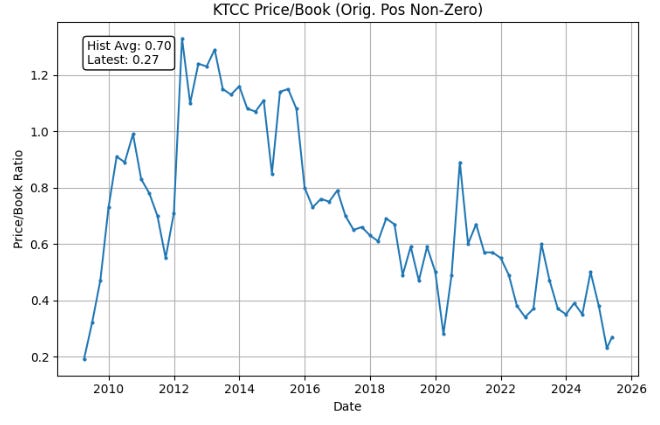

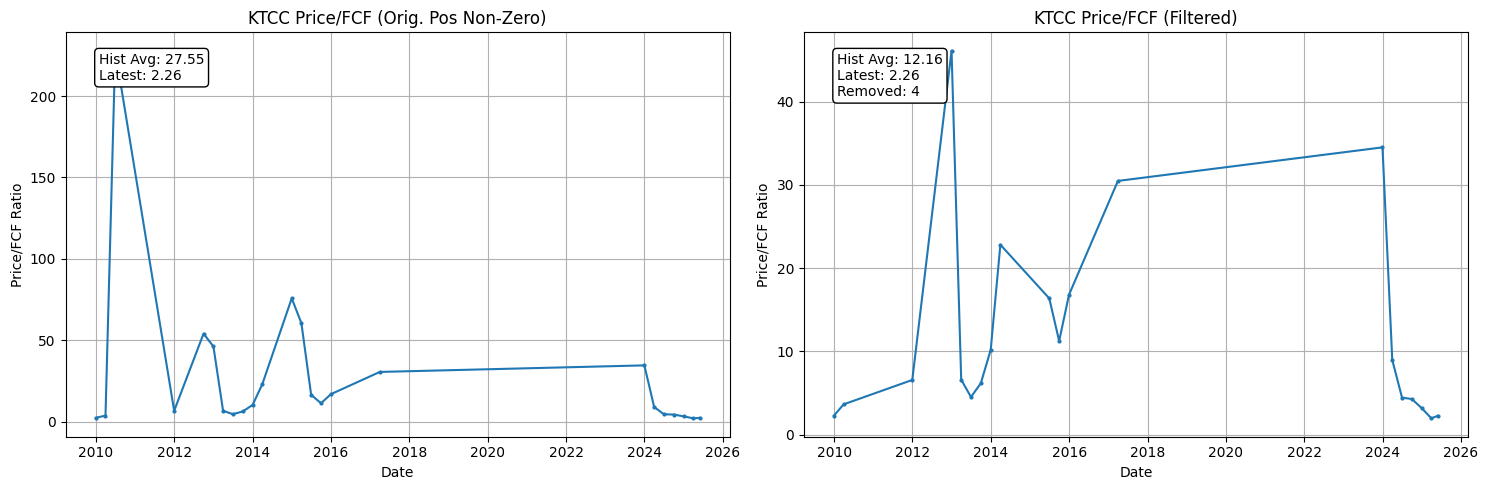
Good News: Growing Sales, Growing Book Value and Rising FCF.
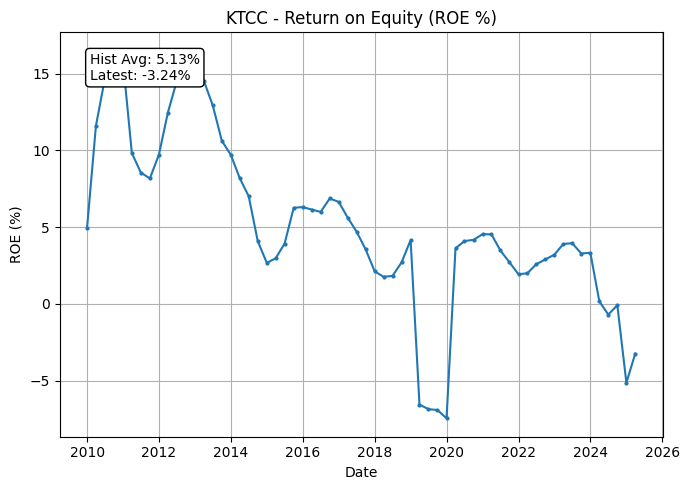
Bad News: Declining EPS.
Let’s examine why. In the third quarter of fiscal year 2025, Key Tronic reported a 21% year-over-year revenue decline, with total revenue dropping from $142.4 million to $112.0 million. This decrease was primarily attributed to global tariff disruptions, which led to increased costs, delays, and reduced customer demand. Additional costs were incurred though losses related to customer collections and severance costs for less than a million.
Business News:
KTCC or KeyTronic is a U.S.-based contract manufacturer specializing in providing comprehensive design and manufacturing services to original equipment manufacturers (OEMs) across various industries. Established in 1969 and headquartered in Spokane Valley, Washington, Key Tronic offers a range of services, including electronic and mechanical engineering, printed circuit board assembly, plastic injection molding, metal fabrication, full product assembly, and supply chain management. Think production of keyboards, game controllers and other 3rd party products that are some combination of plastic and technology.
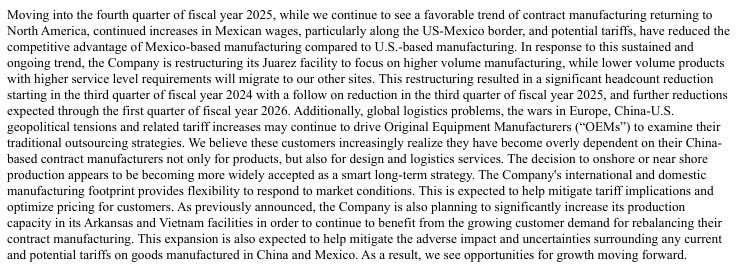
While Tariffs are a concern for most companies, KTCC’s management feels that they are well positioned to take advantage of the flight from Chinese OEMs in favor for those in other locations in other countries such as their factories in Mexico, Vietnam and a newer location in Arkansas. The tariff concern for KTCC is not of impact but of opportunity this would be a question of management being able to capture this new tailwind.
KTCC’s Share Float is 92% Free.
TLF

59.4M in Current Assets
21M in Total Liabilities
26M in Market Cap.
I left this one in as an example of a danger of NCAV valuation which is on how different assets should be valued. TLF has more than enough current assets (cash) to handle its liabilities. The question is on about the 34M in inventory that is effectively just leather. Generally, half off inventory in a liquidation event is a common rule of thumb for NCAVs. Applying this change, current assets drop to 42M leading to a NCAV of 21M vs TLF’s 26M in Market Cap. The inventory discount evaporates the margin of safety here. One can add back in TLF’s properties and equipment along with operating lease assets equally discounted by half to get 8M more back into the NCAV pushing it to 29M vs 26M making it a slight discount of 10%. Ok, now charts!


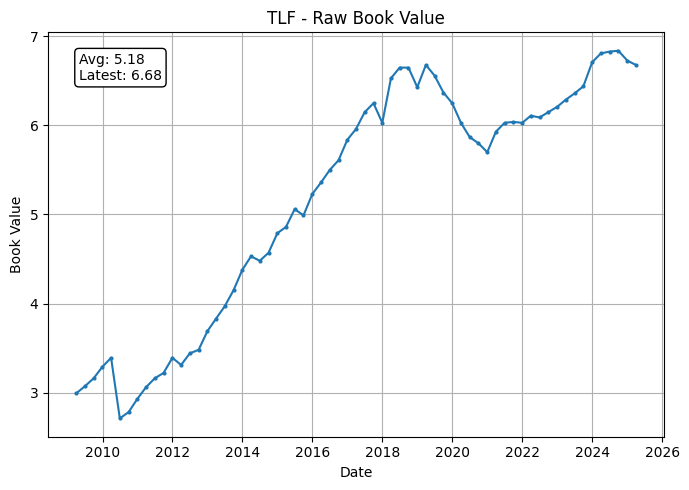
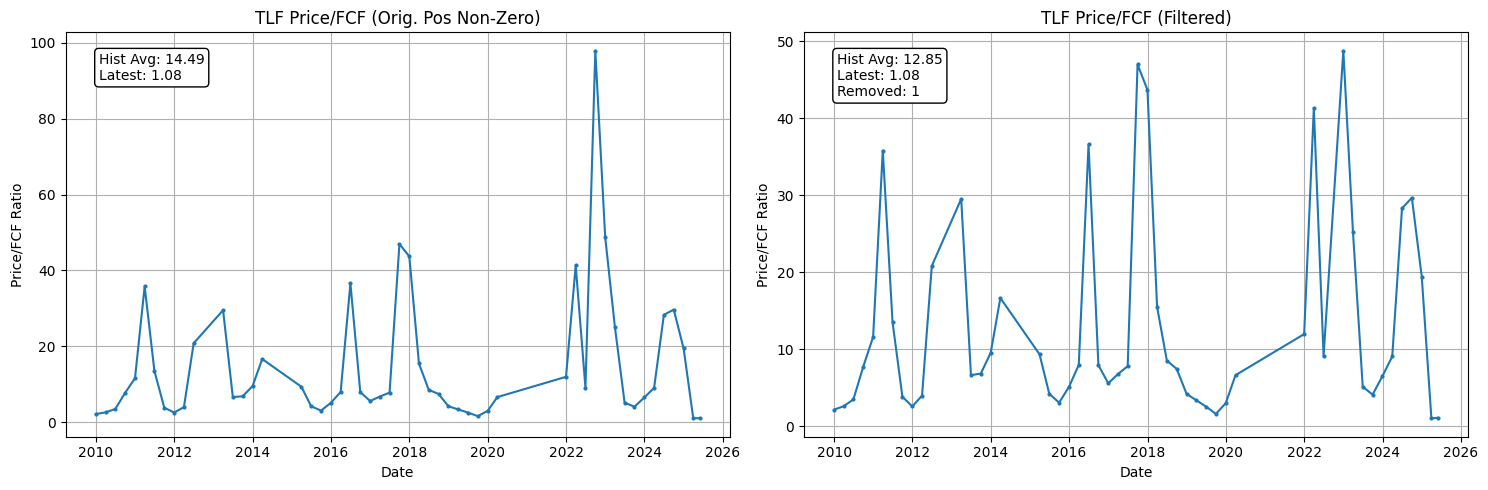
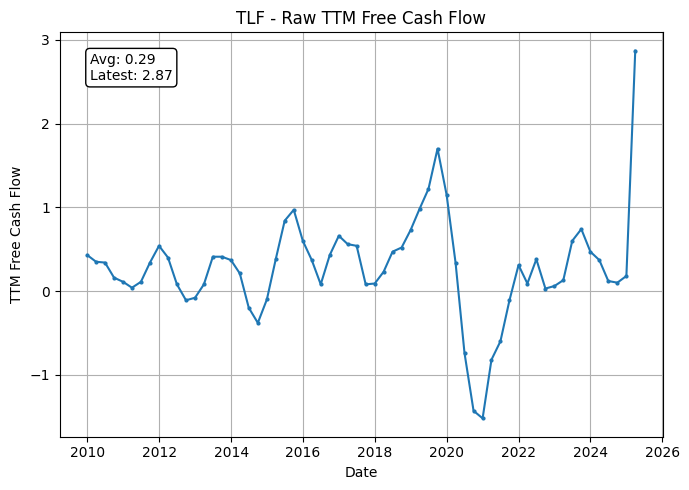
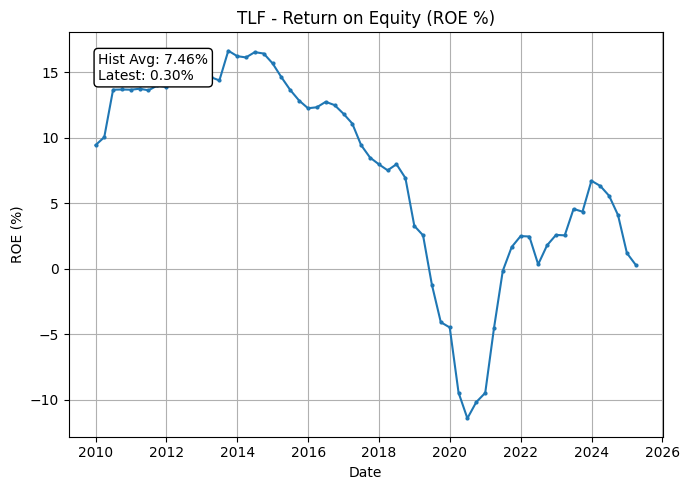
Notes: The spike in Tandy Leather Factory’s (TLF) cash flow during the quarter ended March 31, 2025, was primarily due to the sale of their corporate headquarters. They also incurred $12.7 million in dividends paid during the same quarter, which offset part of the cash inflow from the HQ sale. So, the cash flow spike was a one-time event primarily driven by a real estate transaction, not an operational improvement. Historically TLF has managed to keep itself afloat for a very, very long time.
94% Free Float shares.
TRT

30M in Current Assets (adjusted to reduce inventory value)
7.2M in Total Liabilities
22.1M in Market Cap
26% Discount


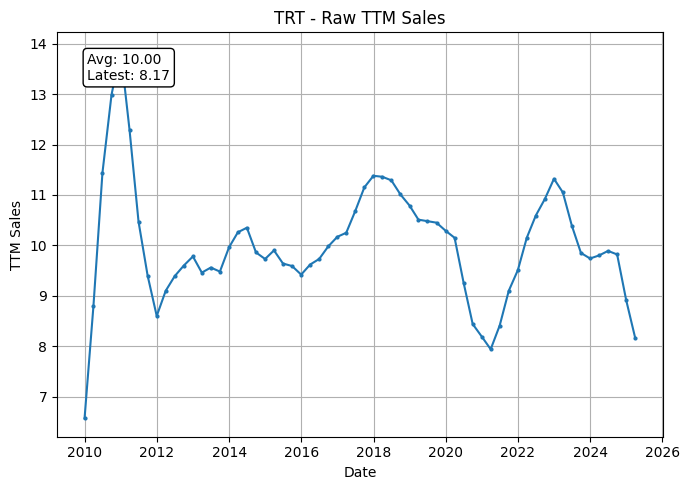


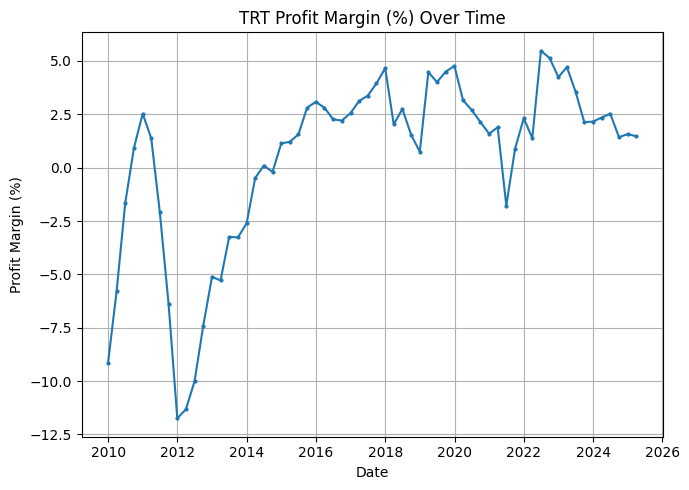
Good News: EPS indicates stable profitability along with cash flow and sales along with rising book value.
Bad News: No growth.
But not negative growth. It’s a good position for a Net-Net to not be losing money.
Business Stuff
Trio-Tech International (TRT) offers what’s commonly referred to as “burn-in” testing. This process subjects chips to elevated voltages and temperatures to weed out early failures and ensure product reliability before they’re integrated into everything from smartphones to industrial systems. These reliability tests are crucial, especially for clients producing chips used in applications like automotive electronics and medical equipment.
In addition to its service business, Trio-Tech also designs and manufactures specialized equipment used in semiconductor testing. This includes burn-in systems, test handling machines, and environmental chambers that simulate real-world conditions. The equipment is sold to other testing labs, semiconductor manufacturers, and academic or research institutions.
Overall, Trio-Tech International ensures that chips actually work as intended. Their focus on reliability and stress testing puts them in a defensive niche, somewhat insulated from broader semiconductor cycles, but also means their growth is more tied to capital expenditures and production trends from upstream chipmakers.
61% Free Float shares
JCTC

A lot of inventory. Infact, they have the entire market cap of the company in just inventory.
23M in Current Assets
15M (Adjusted for Inventory)
4M in Total Liabilities
11M in Current Assets vs 13.51M in Market Cap.
Add in Property, Plant and Equipment and you get roughly fair value here.

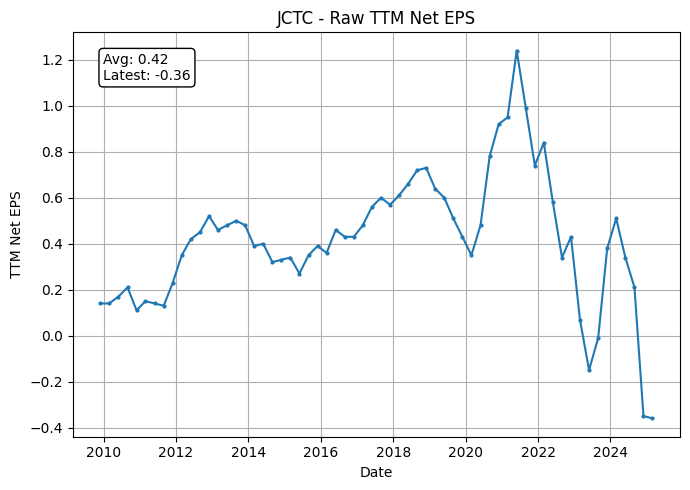
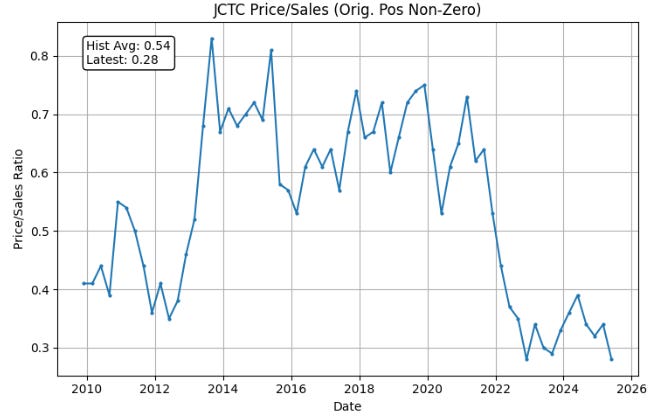


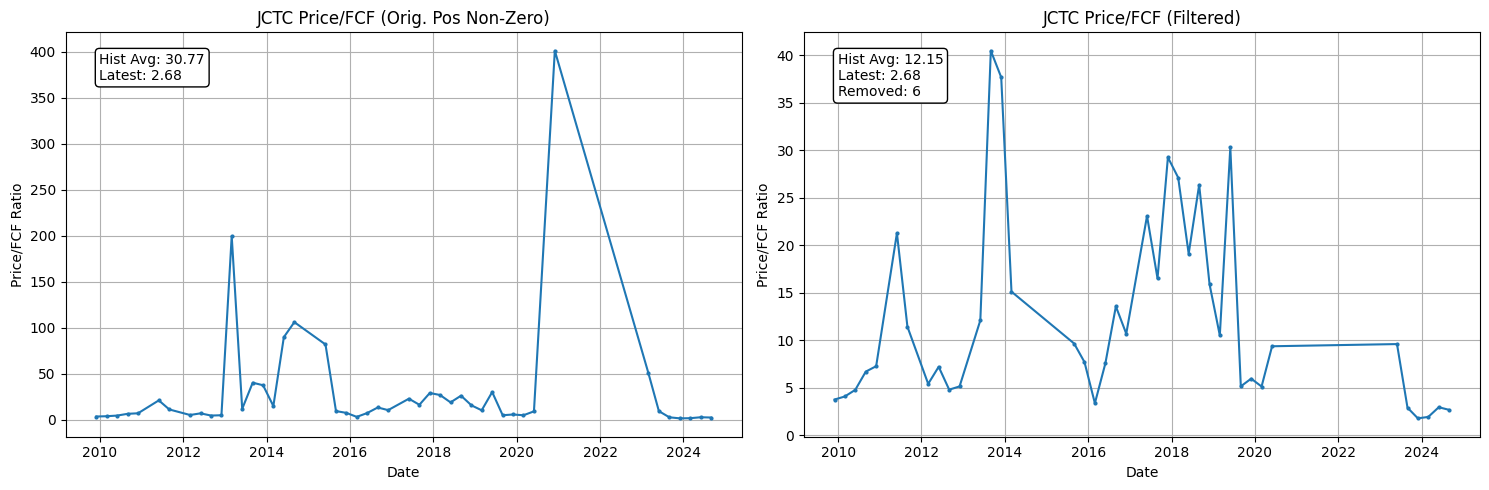


Good News: Rising Book Value, Rising Sales.
Bad News: Volatile FCF and Earnings.
Business Stuff: Jewett-Cameron Trading Company is a diversified small-cap company that operates primarily in the lawn, garden, pet, and fencing product sectors. Their business is based around the sourcing, marketing, and distribution of these consumer products. They design and import products for resale in North America, particularly the U.S. market. It’s just fences and dog kennels


Ultimately, shrinking margins due to tariffs, single supplier and rising shipping costs have all eaten away at the profit potential of JCTC Interestingly enough the declining margins where the impetus for increasing their sourcing locations to other countries which their CEO states that “We’re now sourcing from Mexico, Vietnam, Malaysia — this is giving us better landed costs.” Additionally, JCTC has opted to change their display manufacturing to outside the U.S which the CFO states that the change to overseas displays help them save costs “where cost per unit is 40–50% lower.” In terms of personel, “We’ve frozen new hiring and are tightening SG&A.” So JCTC is aware of the issues and is trying to reverse course on a product line that is maintaining sales growth its just a question of operational efficiency.
72% Free Float shares.
INBP
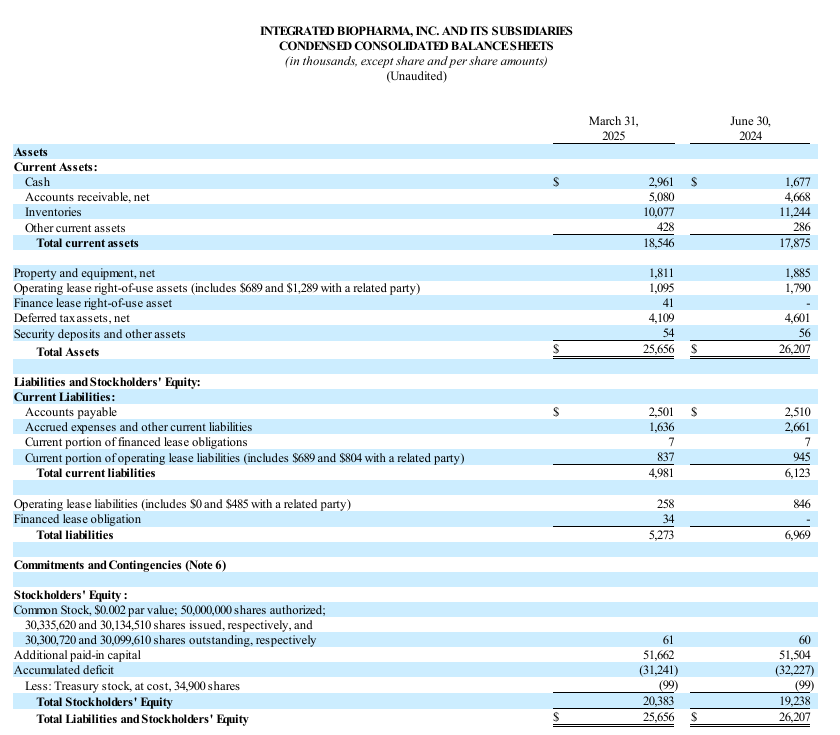
13M in Adjusted Current Assets
5M in Total Liabilities
8M vs 8.8M in Market Cap.
Throw in Property and Other Assets
10M vs 8.8M


Good News: Stable FCF, EPS, sales and growing book value.
Meh News: But not on fire. Just a pile of cash. I can’t be mad at that.
Company Stuff: The majority of revenues comes from their ownership of the Manhattan Drug Co. which is a contract manufacturer and packager for the nutritional supplement industry. Information on this one is pretty sparce. At least the factory looks busy per Google Earth/Maps.
30% Free Float shares.
Conclusion
Each of these stocks trades below or near net current asset value. Some are hidden behind bad optics (like low float, shrinking EPS, or leather warehouses), but they aren’t financial wrecks. Many are stable or improving, even if slowly.
And that’s the point: in a market obsessed with narratives and momentum, these are quiet little balance sheet bargains. If the businesses improve, great. If not, you're still anchored by tangible value.
The scan here was not just for NCAVs and other metrics were also gathered which will be the focus of the next article. Those tickers trading below tangible asset value.