


Kinsale Capital Group, Inc. (NYSE: KNSL) is a Richmond, Virginia–based specialty insurance holding company focused exclusively on the excess & surplus (E&S) market in the United States. Founded in 2009, it underwrites hard-to-place property & casualty coverages for small and mid-sized businesses through a non-admitted platform, and distributes certain products via a wholesale broker subsidiary.

Assets
Investments: 4,203,191 (breakdown of the assets here)
Fixed-maturity securities (fair value): 3,716,253 (Think Treasuries and Municipal Bonds)
Equity securities (fair value): 433,077
Real estate, net: 15,045
Short-term investments: 38,816
Cash and cash equivalents: 142,026
Investment income due and accrued: 27,146
Premiums & fees receivable, net: 148,565
Reinsurance recoverables, net: 374,115
Ceded unearned premiums: 54,073
Deferred policy acquisition costs: 112,313
Intangible assets: 3,538
Deferred income tax asset, net: 50,313
Other assets: 99,719
Total Assets: 5,214,999
Liabilities
Reserves for unpaid losses & loss adjustment expenses: 2,470,643
Unearned premiums: 845,701
Payable to reinsurers: 44,766
Accounts payable & accrued expenses: 22,962
Debt: 184,191
Other liabilities: 63,761
Total Liabilities: 3,632,024
Stockholders’ Equity
Common stock: 234
Additional paid-in capital: 359,154
Retained earnings: 1,314,410
Accumulated other comprehensive loss: (70,824)
Treasury stock: (19,999)
Total Equity: 1,582,975 to 10.5B in Market Cap.
Book Value Growth

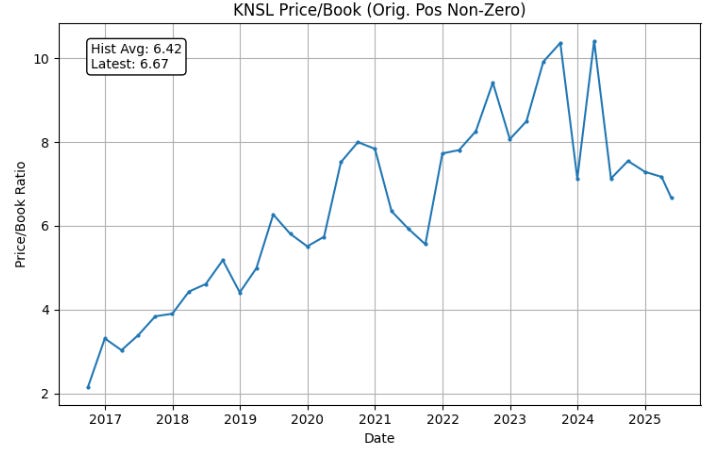
From a balance-sheet standpoint, the price-to-book ratio of 6.67 shows how the market values the company’s net assets. Book value per share growth of 35.00% over one year, 38.82% over two years, and 30.38% over five years underscores ongoing asset accumulation. The PBG ratios—0.19 (1Y), 0.17 (2Y), and 0.22 (5Y). The P/B ratio is near an five year low.
Sales/Revenue Growth


On the top line, the price-to-sales multiple of 6.45 indicates how much investors are paying for each dollar of sales. Sales per share have expanded by 22.72% over the last year, with two-year and five-year CAGRs of 32.82% and 36.95%, respectively. The corresponding PSG ratios—0.28 (1Y), 0.20 (2Y), 0.17 (5Y). P/B remains below the historical average.
EPS Growth

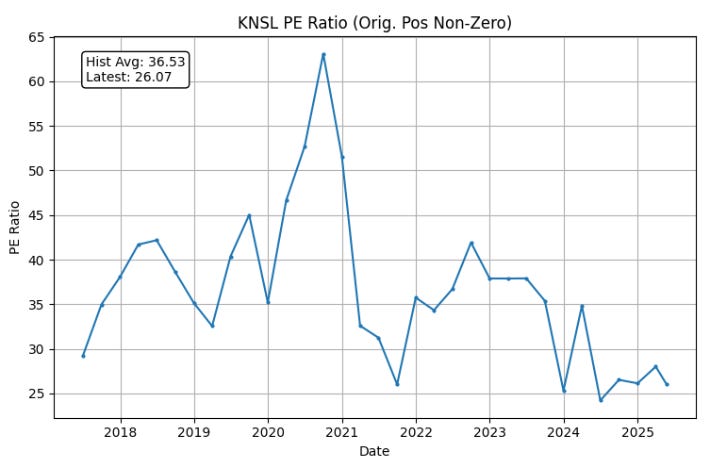
The price-to-earnings ratio sits at 26.07, offering a snapshot of investor sentiment toward the firm’s earnings power. Over the past year, earnings per share have climbed by 15.48%, while a two-year compound annual growth rate of 48.28% and a five-year CAGR of 50.93% underscore sustained profitability gains. When adjusted for growth, the PEG ratios of 1.68 (1Y), 0.54 (2Y), and 0.51 (5Y). P/E ratio remains near historical lows. The question here is if a 25 P/E reasonable for comparison lets take a general view of the insurance P/E ratios.

While KNSL is above average in its P/E ratio, it is the contention of this article that the high and consistent growth enables this P/E ratio to be justified.
FCF Growth


Looking at cash conversion, the price-to-free-cash-flow ratio of 10.98 highlights the market’s valuation of the company’s ability to generate real, spendable cash. Free cash flow per share has risen by 11.29% in the past year, while two-year and five-year CAGRs of 23.78% and 38.04% point to healthy cash-generation trends. The PFCFG ratios—0.97 (1Y), 0.46 (2Y), and 0.29 (5Y). KNSL’s P/FCF Ratio is under the historical average along with being in the average range for the last 5 years.
Summary
Valuation Ratios for KNSL:
• P/E Ratio : 26.07
• P/S Ratio : 6.45
• P/B Ratio : 6.67
• P/FCF Ratio: 10.98
-- Latest TTM Values --
• EPS (TTM) : 17.38
• Sales per Share (TTM) : 70.22
• Book Value per Share : 67.92
• FCF per Share (TTM) : 41.29
• Last Share Price : 453.15 (as of 2025-05-22)
Recap of key growth ratios for KNSL:
• 1Y PEG : 1.68 (1 Year Earnings Growth: 15.48%)
• 2Y PEG : 0.54 (2 Year Earnings Growth: 48.28%)
• 5Y PEG : 0.51 (5 Year Earnings Growth: 50.93%)
• 1Y PSG : 0.28 (1 Year Revenue Growth: 22.72%)
• 2Y PSG : 0.20 (2 Year Revenue Growth: 32.82%)
• 5Y PSG : 0.17 (5 Year Revenue Growth: 36.95%)
• 1Y PFCFG: 0.97 (1 Year FCF Growth: 11.29%)
• 2Y PFCFG: 0.46 (2 Year FCF Growth: 23.78%)
• 5Y PFCFG: 0.29 (5 Year FCF Growth: 38.04%)
• 1Y PBG : 0.19 (1 Year Book Value Growth: 35.00%)
• 2Y PBG : 0.17 (2 Year Book Value Growth: 38.82%)
• 5Y PBG : 0.22 (5 Year Book Value Growth: 30.38%)


DCF????

At an industry average of 15 P/E with a half cagr of its five year average KNSL is undervalued by 11%. If KNSL can keep its growth rate like it has in the past then this would be undervalued by 179% I dont have a price target as I focus on growth ratios being under one as my exit.
Fellow coder here! I see you're making a DCF valuation. I also created one, but with VARIED values for each year - what do you think of such an idea?