


Both The Coca-Cola Company (KO) and PepsiCo (PEP) are global beverage producers that also pay dividends. This comparison is intended purely as an exercise in relative valuation, to deepen our understanding of how these two firms stack up against one another.
Balance Sheets. First up KO.

Coca-Cola (KO)
Total Assets: $101.7 B
Current Liabilities: $23.8 B
Debt: $43.5 B
Other Non-Current Liabilities: $4.3 B
Deferred Income Tax Liabilities: $2.3 B
Shareholders’ Equity: $27.7 B
Market Capitalization: $296 B
Price-to-Book (P/B) Ratio: 10.68
PepsiCo (PEP)

PepsiCo (PEP)
Total Assets: $101.7 B (nearly identical to KO)
Current Liabilities: $31.5 B
Debt: $39.4 B
Other Liabilities: $8.7 B
Deferred Income Tax Liabilities: $3.5 B
Shareholders’ Equity: $18.5 B
Market Capitalization: $180 B
Price-to-Book (P/B) Ratio: 9.27
Products!PEP doesnt do just soda It does chips and stuff.

Coca-Cola: Focuses almost exclusively on beverages. Its largest segment delivers a 30 % operating margin, with its second-largest geographic region at 42 %.
PepsiCo: Splits roughly 50/50 between foods and beverages. Its food segment enjoys a 24.7 % operating margin versus 7.8 % for North American beverages.

4% div yield for PEP
3% div yield for KO
Lets see their book growth.


The Price-to-Book (P/B) ratio is 11.17. Book value per share has increased by -0.6% year-over-year and has a compound annual growth rate (CAGR) of 6.9% across the last five years, resulting in a 1-year PBG ratio of -18.12 and a 5-year PBG ratio of 1.62.


The Price-to-Book (P/B) ratio is 9.78. Book value per share has increased by -3.3% year-over-year and has a compound annual growth rate (CAGR) of 6.7% across the last five years, resulting in a 1-year PBG ratio of -2.97 and a 5-year PBG ratio of 1.46.
Takeaway: Both companies’ book-value growth is similar over five years, but PepsiCo’s slightly lower P/B and steadier capital efficiency in revenue generation give it a small edge. Coca-Cola’s book growth trend is steadier, however.
Revenue!


The Price-to-Sales (P/S) ratio stands at 6.63. Sales per share has shown a year-over-year growth of 2.2% and a compound annual growth rate (CAGR) of 4.8% over the past five years, leading to a 1-year PSG ratio of 3.06 and a 5-year PSG ratio of 1.39.
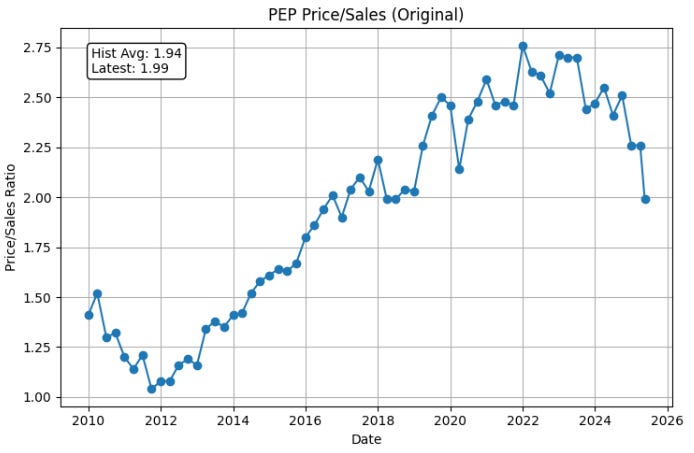

The Price-to-Sales (P/S) ratio stands at 1.99. Sales per share has shown a year-over-year growth of -0.0% and a compound annual growth rate (CAGR) of 6.5% over the past five years, leading to a 1-year PSG ratio of -44.08 and a 5-year PSG ratio of 0.31.
Takeaway: Coca-Cola sold off many bottling operations between 2016 and 2021, causing revenue dips. Despite modest top-line growth, its share price surge pushes P/S to roughly a 15-year high. PepsiCo’s flat recent sales plus a depressed share price yield a much lower PSG, making its growth appear more attractively priced.
Earnings.


The Price-to-Earnings (P/E) ratio is currently 28.80. Earnings Per Share (EPS) has demonstrated a growth of 0.0% over the past year and a compound annual growth rate (CAGR) of 1.5% across the last five years, resulting in a 1-year PEG ratio of NAN (yeah 0 growth will do that to values) and a 5-year PEG ratio of 19.12.


The Price-to-Earnings (P/E) ratio is currently 19.41. Earnings Per Share (EPS) has demonstrated a growth of 2.3% over the past year and a compound annual growth rate (CAGR) of 5.7% across the last five years, resulting in a 1-year PEG ratio of 8.61 and a 5-year PEG ratio of 3.40.
Observation: Coca-Cola’s stagnant EPS growth versus its high multiple raises questions about justifying its valuation. Both firms maintain similar payout ratios (KO ~78 %, PEP ~76 %), which, combined with slowing earnings, could pressure dividend sustainability if not supported by cash flow.
Free Cash Flow


What a drop. Oh its the Fairlife aquisition that hit its financial milestone for 2025 and as a result got 6B. The payment indicates that Fairlife has grown to a satisfactory amount for KO.
(Great milk btw.)

Adding back in the Fairlife payment results in a FCF of 558M for the quarter. Nothing too crazy in relation to the past. KO’s aquisition has us having to make an adjustment to the FCF

558M places us in an healthy range in relation to KO’s historical quarterly cash flow. So for our purposes here we’ll assume a 28 P/FCF along with a TTM of 2.25 FCF.
Even after adjusting for the Fairlife transaction, 1.79 TTM FCF in 2020 compared to the adjusted FCF of 2.25 per share we get a 5% CAGR of 4.68% giving us a P/FCF ratio of 32 and a FCF Growth ratio of 6.8.
Ok PEP


The shares are trading at a multiple of 23.53 times Free Cash Flow (FCF). FCF per share has experienced a growth of 4.5% in the last year and a compound annual growth rate (CAGR) of 9.0% over the past five years, yielding a 1-year PFCF-growth multiple of 5.26 and a 5-year PFCF-growth multiple of 2.62.
Summary & Tables
Coca-Cola commands higher valuation multiples across P/B, P/S, P/E, and P/FCF, despite weaker growth in earnings, book value, and free cash flow.
PepsiCo benefits from a diversified product mix, stronger five-year growth rates, and lower relative multiples, positioning it as the more attractively valued of the two on most metrics.
Dividend yields are comparable (PEP ~4 %, KO ~3 %), but PepsiCo’s superior growth and cash-flow profile underpin better support for its payout.
PEP over KO there I said it if I had to choose.
KO Table of Metrics
Valuation Ratios for KO:
• P/E Ratio : 28.80
• P/S Ratio : 6.63
• P/B Ratio : 11.17
• P/FCF Ratio: 28 (adjusted for the Fairlife otherwise it’d be negative lmao)
-- Latest TTM Values --
• EPS (TTM) : 2.50
• Sales per Share (TTM) : 10.86
• Book Value per Share : 6.45
• FCF per Share (TTM) : 2.25
• Last Share Price : 72.00
Earnings-per-Share – YoY: 0.00% | 5-Y CAGR: 1.51%
Sales-per-Share – YoY: 2.16% | 5-Y CAGR: 4.75%
Free-Cash-Flow/share– YoY: -8.01% | 5-Y CAGR: 4.68% (Adjusted for Fairlife)
Book-Value/share – YoY: -0.62% | 5-Y CAGR: 6.90%
Recap of key growth ratios for KO:
• 1Y PEG : NAN 5Y PEG : 19.124755
• 1Y PSG : 3.064213 5Y PSG : 1.394793
• 1Y PFCFG: NAN 5Y PFCFG: 32
• 1Y PBG : -18.123325 5Y PBG : 1.618274
PEP Table of Metrics
Valuation Ratios for PEP:
• P/E Ratio : 19.41
• P/S Ratio : 1.99
• P/B Ratio : 9.78
• P/FCF Ratio: 23.53
-- Latest TTM Values --
• EPS (TTM) : 6.80
• Sales per Share (TTM) : 66.42
• Book Value per Share : 13.50
• FCF per Share (TTM) : 5.61
• Last Share Price : 131.98
Earnings-per-Share – YoY: 2.26% | 5-Y CAGR: 5.72%
Sales-per-Share – YoY: -0.05% | 5-Y CAGR: 6.48%
Free-Cash-Flow/share– YoY: 4.47% | 5-Y CAGR: 8.98%
Book-Value/share – YoY: -3.30% | 5-Y CAGR: 6.70%
Recap of key growth ratios for PEP:
• 1Y PEG : 8.605100 5Y PEG : 3.395309
• 1Y PSG : -44.078500 5Y PSG : 0.306967
• 1Y PFCFG: 5.264837 5Y PFCFG: 2.620831
• 1Y PBG : -2.968017 5Y PBG : 1.458833
Growth Charts. (You can really see PEP’s attractiveness)

