


Back to finding GARP.
Balance Sheet.

35.5B in Current Assets
115B in Total Assets
25B in Current Liabilities
33.5B in Long-Term Debt
8B in Other Liabilities
48.4B in Equity
193B Market Cap


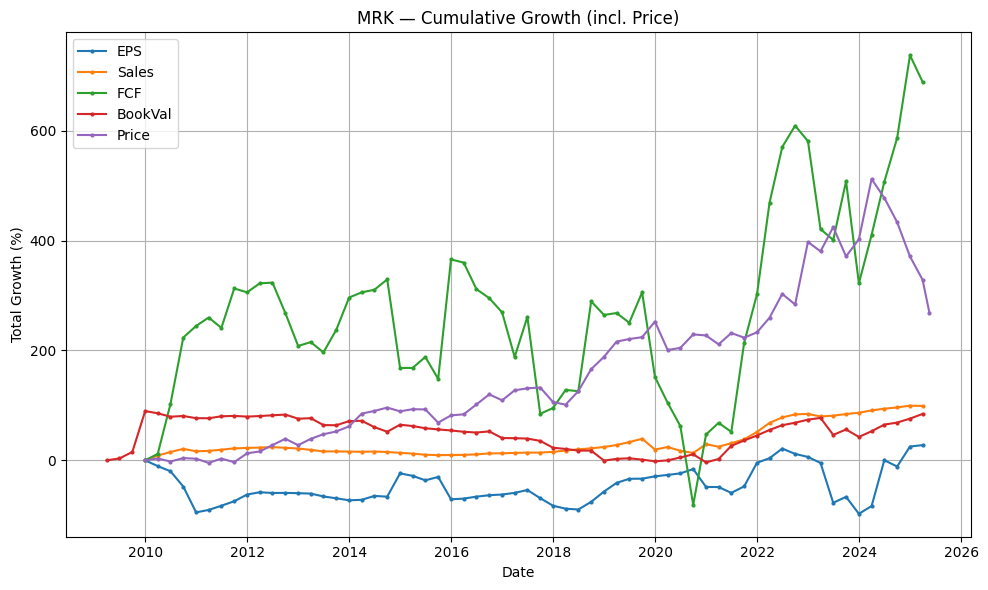
From a balance-sheet standpoint, the price-to-book ratio of 4.01 shows how the market values the company’s net assets. Book value per share growth of 20.55% over one year, 2.01% over two years, and 13.05% over five years underscores ongoing asset accumulation. The PBG ratios are as follows; 0.20 (1Y), 2.00 (2Y), and 0.31 (5Y). Additionally, the P/B Ratio is near a 6-year low.
Revenue


On the top line, the price-to-sales multiple of 3.07 indicates how much investors are paying for each dollar of sales. Sales per share have expanded by 4.27% over the last year, with two-year and five-year CAGRs of 5.18% and 9.89%, respectively. The corresponding PSG ratios are as follows; 0.72 (1Y), 0.59 (2Y), 0.31 (5Y). The P/S ratio is near a 6-year low as well.
Earnings.
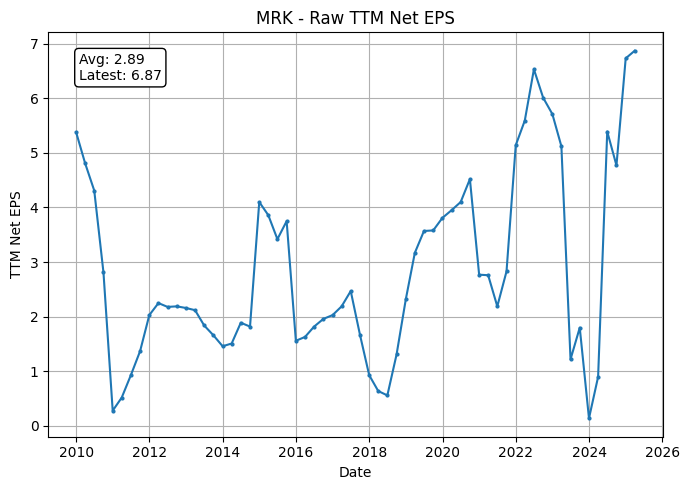

The price-to-earnings ratio sits at 11.24, offering a snapshot of investor sentiment toward the firm’s earnings power. Over the past year, earnings per share have climbed by 663.33% (We are just going to ignore that), while a two-year compound annual growth rate of 15.82% and a five-year CAGR of 11.71% underscore sustained profitability gains. When adjusted for growth, the PEG ratios are as follows; 0.02 (1Y), 0.71 (2Y), and 0.96 (5Y). P/E Ratio sits at an 10-year low.
Cash Flow


Looking at cash conversion, the price-to-free-cash-flow ratio of 11.51 highlights the market’s valuation of the company’s ability to generate real, spendable cash. Free cash flow per share has risen by 54.61% in the past year, while two-year and five-year CAGRs of 23.05% and 30.99% point to healthy cash-generation trends. The PFCFG are 0.21 (1Y), 0.50 (2Y), and 0.37 (5Y). The P/FCF Ratio sits at a 9-Year low.
Summary
Valuation Ratios for MRK:
• P/E Ratio : 11.24
• P/S Ratio : 3.07
• P/B Ratio : 4.01
• P/FCF Ratio: 11.51
-- Latest TTM Values --
• EPS (TTM) : 6.87
• Sales per Share (TTM) : 25.17
• Book Value per Share : 19.24
• FCF per Share (TTM) : 6.71
• Last Share Price : 77.23 (as of 2025-05-19)
Recap of key growth ratios for MRK:
• 1Y PEG : 0.02 (1 Year Earnings Growth: 663.33%)
• 2Y PEG : 0.71 (2 Year Earnings Growth: 15.82%)
• 5Y PEG : 0.96 (5 Year Earnings Growth: 11.71%)
• 1Y PSG : 0.72 (1 Year Revenue Growth: 4.27%)
• 2Y PSG : 0.59 (2 Year Revenue Growth: 5.18%)
• 5Y PSG : 0.31 (5 Year Revenue Growth: 9.89%)
• 1Y PFCFG: 0.21 (1 Year FCF Growth: 54.61%)
• 2Y PFCFG: 0.50 (2 Year FCF Growth: 23.05%)
• 5Y PFCFG: 0.37 (5 Year FCF Growth: 30.99%)
• 1Y PBG : 0.20 (1 Year Book Value Growth: 20.55%)
• 2Y PBG : 2.00 (2 Year Book Value Growth: 2.01%)
• 5Y PBG : 0.31 (5 Year Book Value Growth: 13.05%)

Products!
Revenue in Millions
Keytruda: 7.2B
Gardasil / Gardasil 9: 1.3B
Livestock Medicines: .9B
Other pharmaceutical products: 729M
Companion Animal: 664M
Januvia: 549M
ProQuad / M-M-R II / Varivax: 539M
Bridion: 441M
Lynparza (alliance revenue): 312M
Winrevair: 280M
Keytruda's patents are set to expire around 2028 in Europe and potentially later in the U.S. (e.g., 2036 for some patents). While this is a significant concern, navigating blockbuster patent expirations is not new for Merck. Previously, major drugs like Singulair, Zocor, Cozaar/Hyzaar, Fosamax, and Januvia/Janumet each contributed significantly to revenues, often in the 11-20% range at their peaks. Patent expirations become critical when the development pipeline is weak. However, Merck is proactively addressing this by strengthening its pipeline through strategic acquisitions, including Prometheus Biosciences, Caraway Therapeutics, Harpoon Therapeutics, Abceutics, EyeBio, and Modifi Biosciences. Given this consistent M&A activity and focus on partnerships, it appears likely that Merck is working to develop replacements for Keytruda's future revenue stream.
Between P/E expansion and modest EPS growth Merck will most likely be above it’s current price in the future. Id keep an eye on the 5Y PEG value which suggests a price above 81.