

Nice
I Lied. This one is going to have one number over 1 sorry.

I really REALLY wanted to think about some overseas stocks. Only found one: NICE.
NICE is a global enterprise software company that provides solutions designed to enhance customer engagement, automate operations, and manage risk and compliance. NICE offers cloud‑based solutions that help organizations automate and optimize customer service. Their flagship CXone Mpower platform is designed to seamlessly integrate AI-powered tools with human agents and enterprise data, enabling superior customer experiences, efficient workflow orchestration, and even supporting public safety and justice needs.
They also provide self‑service and digital engagement solutions that empower customers to customize and extend the platform’s functionality via APIs and intuitive tools. NICE delivers embedded, AI‑driven solutions that help financial institutions detect and prevent fraud, money laundering, and market abuse in real time. Their offerings include a broad range of engineered models covering traditional and emerging risk types—such as account takeover and cryptocurrency risks—as well as intelligent investigation tools that streamline workflows for compliance analysts.
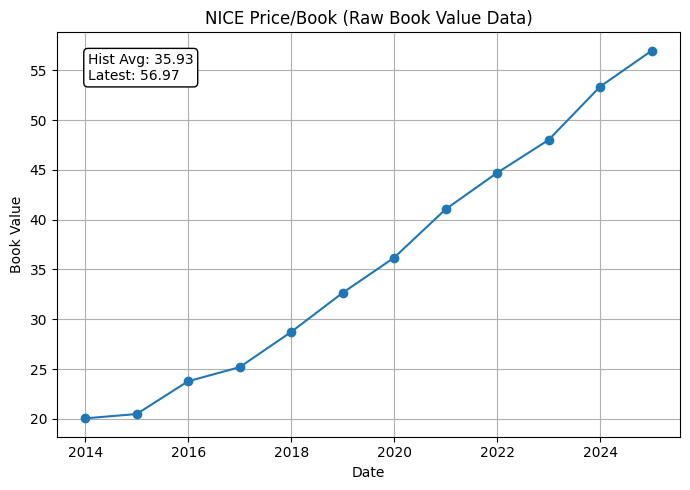
Here’s the chart so you have it in your mind.

Onto what they own


Onto what they own:
Market Cap: $9.6B
Equity: $3.6B → Translates to $57 per share
Current Share Price: $150 (thanks, Liberation Day)
→ More than a third of the share price is equity. Nice.
Let’s check the growth:Because the company is an ADR, its book values are annualized—not quarterly.
Book Value Growth:
1-Year: 6.8%
5-Year CAGR: 9.5%
P/B Ratio: 2.77
YoY P/B Growth Ratio: 0.40
5-Year P/B Growth Ratio: 0.29
Sales!

Sales:
P/S Ratio: 3.79
YoY Sales Growth: 16.33% → PSG Ratio: 0.232
5-Year Sales CAGR: 11.29% → 5-Year PSG Ratio: 0.335
Lets repeat the same for Earnings and FCFEarnings:
P/E Ratio: 22.24
YoY Earnings Growth: 32.8% → PEG Ratio: 0.71
5-Year Earnings CAGR: 18.68% → 5-Year PEG Ratio: 1.24
(Yeah this is the lie. Sorry!)
Note: In September 2015, NICE sold its Physical Security business unit. Removing that segment from continuing operations boosted the EPS by eliminating a low-margin or loss-making unit. That’s why trailing EPS nearly doubled. This does not impact the current ratios just in case you were wondering as I did.

Free Cash Flow (FCF):
P/FCF Ratio: 14.1
YoY FCF Growth: 55.41% → PFCFG Ratio: 0.25
5-Year FCF CAGR: 18.28% → 5-Year PFCFG Ratio: 0.77

There are two ways a P/E ratio goes down: either the price drops or EPS goes up. It's very, VERY rare to see both happening at the same time.
Here we’ve got a falling share price, growing book value, rising FCF, strong earnings, and solid sales growth.
Yeah. A great company (assuming it keeps it up).
Keep on compounding.