
PEG Ratios
How I try to find value? Is it growth?

Decoding the PEG Ratio: More Than Just a P/E
In the quest to find undervalued gems in the stock market, investors often turn to the Price-to-Earnings (P/E) ratio. It's a classic for a reason, offering a quick snapshot of how much investors are willing to pay for each dollar of a company's earnings. But what if we could add another dimension to this analysis, factoring in a company's growth potential? Enter the PEG ratio.
Think of the PEG ratio as the P/E ratio's more insightful cousin. While the P/E ratio tells you how expensive a stock is relative to its current earnings, the Price/Earnings to Growth (PEG) ratio goes a step further by dividing the P/E ratio by the company's expected earnings growth rate. This gives us a more nuanced perspective on whether a stock's valuation is justified by its future prospects.
The calculation is straightforward:
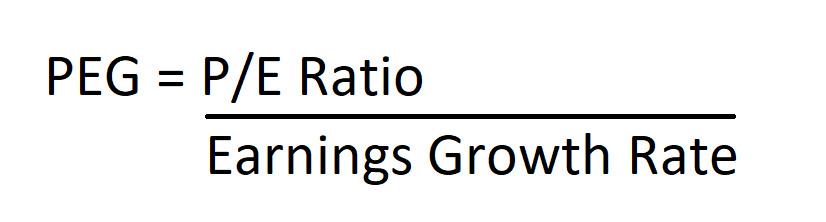
The expected earnings growth rate is typically expressed as a percentage. For instance, if a company has a P/E ratio of 20 and an expected annual earnings growth rate of 15%, its PEG ratio would be 20/15 = 1.33
Let's consider two hypothetical companies in the tech sector:
Tech Innovators Inc. (TII): Trades at a P/E of 30, and analysts project an average annual earnings growth rate of 25% over the next five years. PEG Ratio for TII=25/30=1.2
Stable Tech Corp. (STC): Trades at a lower P/E of 15, but its expected annual earnings growth rate is only 8%. PEG Ratio for STC=8/15≈1.88
Based purely on the P/E ratio, STC might appear cheaper. However, the PEG ratio suggests that TII could be the more attractive investment. Even though its P/E is higher, its strong growth prospects make its valuation seem more reasonable (a PEG closer to 1). STC, on the other hand, has a higher PEG, implying investors are paying a premium even for its lower growth.
Navigating the Pitfalls: When the PEG Ratio Can Mislead
While the PEG ratio is a valuable tool, it's crucial to recognize its limitations:
Reliance on Growth Forecasts: The PEG ratio heavily depends on the accuracy of future earnings growth estimates. These forecasts are inherently uncertain and can be influenced by various economic and company-specific factors. If the actual growth falls short, a stock with a seemingly attractive PEG could turn out to be overvalued.
Ignoring Other Important Factors: The PEG ratio focuses solely on earnings and growth. It doesn't consider other crucial aspects of a company's financial health, such as its debt levels, cash flow, competitive landscape, or management quality. A low PEG might be tempting, but it's essential to dig deeper into the company's fundamentals.
Industry and Company Life Cycle Differences: Comparing PEG ratios across different industries can be misleading. High-growth industries often naturally command higher P/E ratios and consequently, potentially higher but still reasonable PEGs. Similarly, a young, rapidly expanding company might have a higher "justifiable" PEG than a mature, slower-growing one.
One-Time Events and Earnings Volatility: A company's earnings can be temporarily inflated or deflated by one-time events. Relying on a single year's earnings or a short-term growth forecast in the PEG calculation can provide a distorted picture. It's often better to use an average of past earnings or a longer-term growth projection.
Negative Earnings: The PEG ratio isn't meaningful when a company has negative earnings, as the P/E ratio itself is undefined in such cases.
Refining the PEG Ratio: A Look Backwards and Long-Term
To mitigate the risks associated with relying solely on future earnings projections, we can enhance the PEG ratio by incorporating historical growth data. This provides a more grounded perspective, acknowledging the company's demonstrated ability to expand its earnings.
Let's consider a modified PEG approach that incorporates:
Positive P/E: We'll focus on companies with profitable operations, indicated by a positive P/E ratio.
Current Ratio > 1: This suggests the company has sufficient liquid assets to cover its short-term liabilities, indicating a degree of financial stability.
Debt-to-Equity Ratio < 0.5: A low debt-to-equity ratio implies the company relies more on equity financing than debt, generally indicating lower financial risk.
Historical Growth Perspective: Instead of solely relying on a single-year future growth estimate, we'll consider a combination of:
Recent Annual Earnings Growth: The year-over-year growth rate provides a current snapshot.
5-Year Average Earnings Growth: This longer-term perspective helps smooth out cyclical fluctuations and offers a broader view of the company's growth trajectory.
Only those tickers that are undervalued in terms of their growth across multiple time frames would remove the “lumpiness” typically seen in younger companies experencing one time events that can boost yearly earnings growth.
Here we try to apply the PEG ratio logic to other things such as P/S P/B and P/FCF.
Beyond Earnings: Applying the Growth Ratio Logic to Sales, Book Value, and Free Cash Flow
The beauty of the PEG ratio lies in its elegant simplicity: it normalizes a valuation multiple (P/E) by a relevant growth rate (earnings growth). This same logic can be extended to other key valuation metrics, offering a more comprehensive view of whether a company's price is justified by its underlying growth across different facets of its business. By focusing on companies that show consistent undervaluation relative to their growth across multiple timeframes, we aim to filter out temporary spikes and identify potentially more stable opportunities.
1. Price-to-Sales to Sales Growth (PSG):
Concept: The Price-to-Sales (P/S) ratio tells us how much investors are willing to pay for each dollar of a company's revenue. By dividing this by the company's sales growth rate, we get the PSG ratio. A lower PSG might suggest that the market isn't fully appreciating the company's top-line expansion.
2. Price-to-Book to Book Value Growth (PBG):
Concept: The Price-to-Book (P/B) ratio compares a company's market capitalization to its book value (assets minus liabilities). Dividing this by the growth rate of the book value per share gives us the PBG ratio. A low PBG might suggest the market isn't fully valuing the growth of the company's net assets.
3. Price-to-Free Cash Flow to Free Cash Flow Growth (PFCFG):
Concept: The Price-to-Free Cash Flow (P/FCF) ratio indicates how much investors are paying for each dollar of free cash flow the company generates. Normalizing this by the free cash flow per share growth rate gives us the PFCFG ratio. A lower PFCFG might suggest the market isn't fully recognizing the growth in the company's ability to generate cash.
Legendary investor Peter Lynch, famous for his "buy what you know" philosophy and his incredible track record at the Magellan Fund, emphasized the importance of understanding a company's growth prospects relative to its price. While he didn't explicitly coin the terms "PSG," "PBG," or "PFCFG," the spirit of these extended growth ratios aligns perfectly with his core principles.
Lynch often spoke about finding "stalwarts" with dependable growth at a reasonable price. Our approach of analyzing growth across earnings, sales, book value, and free cash flow echoes this. By looking beyond just earnings (the focus of the classic PEG ratio), we gain a more holistic view of whether a company's price is justified by its overall expansion.
By demanding undervaluation relative to growth across all four metrics (earnings, sales, book value, and free cash flow), we're essentially seeking companies that embody Lynch's idea of growth at a reasonable price, but with a more rigorous, multi-faceted lens. Instead of just one "G," we're looking for a consistent story of expansion across the fundamental drivers of a business. This increases our conviction that the market may be overlooking a company with strong, broad-based growth available at an attractive valuation – the kind of opportunities Peter Lynch was so adept at uncovering.
Conclusion
By extending the logic of the PEG ratio to sales, book value, and free cash flow, and by demanding consistent undervaluation relative to growth across multiple timeframes, we move towards a more rigorous and holistic method for identifying potential investment opportunities. This multi-dimensional approach aims to uncover companies demonstrating broad-based expansion across their fundamental drivers, echoing the principles of value and growth championed by investors like Peter Lynch. Ultimately, by looking beyond a single metric, we strive to increase our confidence in finding truly undervalued companies with sustainable growth prospects.
Application
Okay, let's expand on that section, looking ahead to the upcoming quarterly reports and what that means for evaluating the strategy:
"The theoretical framework discussed above isn't just an academic exercise. Applying our stringent screening criteria – demanding growth ratios under 1.10 across both 1-year and 5-year periods for earnings, sales, book value, and free cash flow – yielded a focused portfolio of eleven tickers as of March 31st, 2025: ANET, CPRX, CRUS, EME, FIX, META, NMIH, NVDA, NYT, RMD, and USLM.
To gain an initial observation of this strategy's potential, an equally weighted portfolio was hypothetically constructed on March 31st, 2025. As illustrated in the accompanying chart, which tracks the portfolio's cumulative return against the SPY ETF (a broad market benchmark), the portfolio has shown a positive cumulative return of 2.63% over the single month since its hypothetical inception, compared to the SPY's -1.56% return during the same brief period.
Examining the final cumulative returns for each individual holding provides a glimpse into the stock-specific price action over this limited timeframe. It is crucial to emphasize that this one-month period is far too short to draw any meaningful conclusions about the long-term efficacy of this fundamental screening process, which is designed to identify opportunities based on quarterly financial data. This early snapshot should be viewed merely as an anecdotal observation of initial price movements.
Over the coming months, as more quarterly data becomes available, we will gain a much clearer picture of the effectiveness of this value-oriented growth strategy in identifying companies with enduring fundamental strength and the potential for sustained market outperformance. The initial one-month observation offers a preliminary glimpse, but the quarterly reports will provide the substantive data necessary for a more informed assessment.