


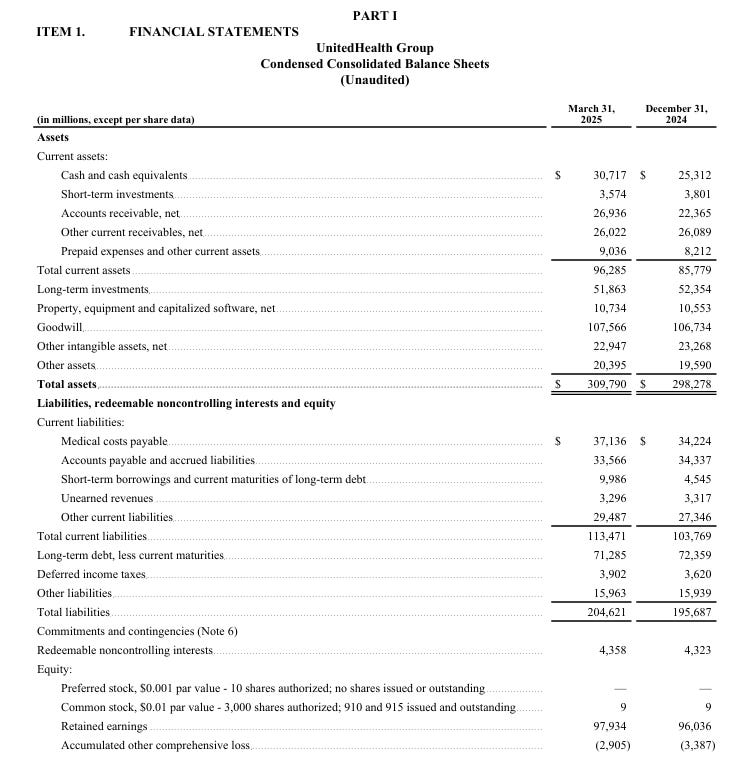
We’re going to be a bit harsh here—halving their goodwill. UNH currently has $52B in equity and a market cap of $275.06B. At least equity is still positive.
Book Value

For about $300, you’re getting $107 in equity.

While UNH lacks inventory, it makes up for that in intangibles.

Of the $325 per share in assets, just shy of $140 is in goodwill and intangibles.

So, keep that in mind when thinking about the book value.
Revenue Growth
1-Yr Growth: 9.80%
2-Yr CAGR: 9.18%
3-Yr CAGR: 10.99%
4-Yr CAGR: 11.78%
5-Yr CAGR: 11.21%
6-Yr CAGR: 10.46%
7-Yr CAGR: 10.29%
These numbers are solid, but share buybacks have augmented them. Adjusting for buybacks, add 1–2% to each figure:
1-Yr Growth: 10.28%
2-Yr CAGR: 10.65%
3-Yr CAGR: 12.42%
4-Yr CAGR: 12.95%
5-Yr CAGR: 12.25%
6-Yr CAGR: 11.58%
7-Yr CAGR: 11.44%
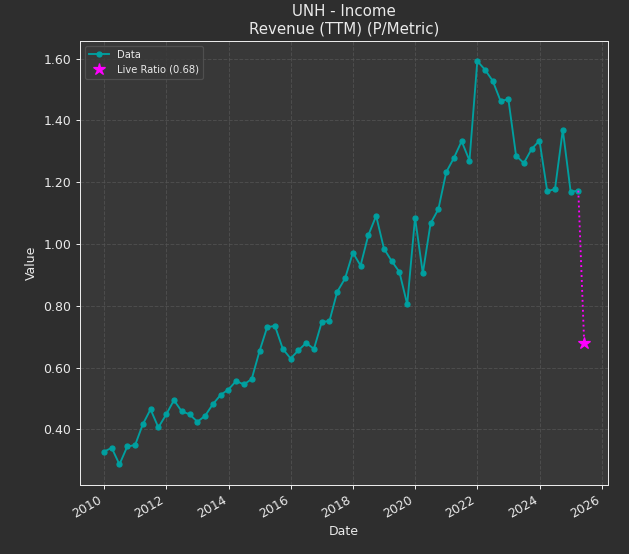
Currently trading at a P/S ratio of 0.68 its lowest in 10 years. Worth noting.
Earnings.


One time charge is that random spike down. Let’s just get rid of that.

The power of having your own data.
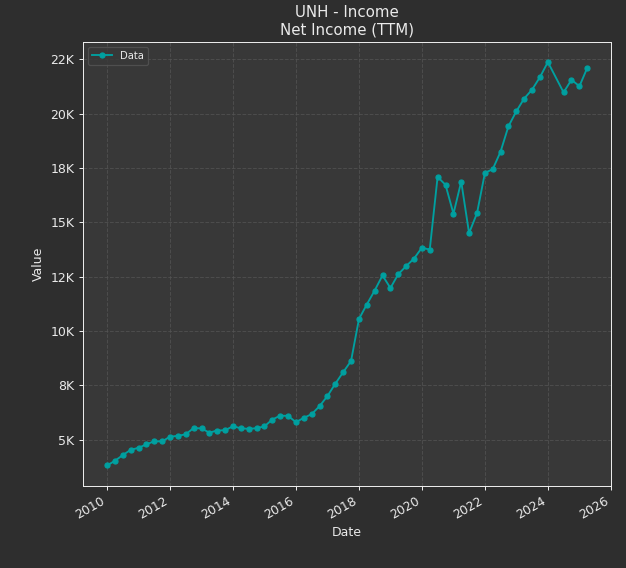

At a P/E of 12.6, the adjusted EPS growth rate is almost 1:1 (1.14 PEG Ratio) when compared to the growth rate hovering around PEG parity.
1-Yr Growth: 0.92%
2-Yr CAGR: 6.63%
3-Yr CAGR: 10.02%
4-Yr CAGR: 10.71%
5-Yr CAGR: 10.95%
6-Yr CAGR: 12.01%
7-Yr CAGR: 12.26%
With the P/E at an 11-year low and PEG near 1, UNH looks under- or fairly valued on that basis.
Free Cash Flow
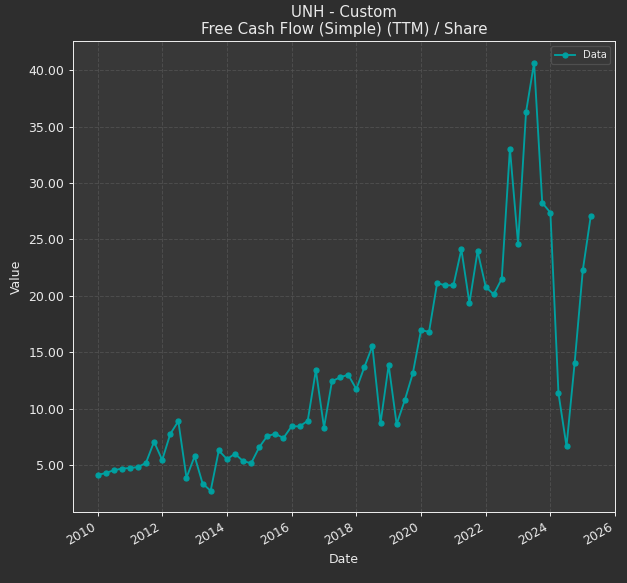

At a P/FCF of 11 compared to a FCF growth rate of somewhere between 8-10%.
3-Yr CAGR: 10.37%
4-Yr CAGR: 2.94%
5-Yr CAGR: 9.98%
6-Yr CAGR: 20.96%
7-Yr CAGR: 10.23%
Acceptable.
Surprise New Metric: Cash Flow From Operations (CFFO)


1-Yr Growth: 106.27%
2-Yr CAGR: -11.28%
3-Yr CAGR: 11.02%
4-Yr CAGR: 4.18%
5-Yr CAGR: 10.46%
6-Yr CAGR: 19.16%
7-Yr CAGR: 10.23%
CFFO growth is decent.
P/CFFO is under the average growth rate and under its historical average. Unexpectedly solid.
Owners Earnings.
Net Income + Non-cash Charges - Maintenance CapEx

1-Yr Growth: -73.14% (SEE CORRECTION AT END OF ARTICLE)2-Yr CAGR: N/A
3-Yr CAGR: -5.51%
4-Yr CAGR: -7.13%
5-Yr CAGR: 42.77%
6-Yr CAGR: -8.96%
7-Yr CAGR: 13.09%
Price to Owner’s Earnings: 23. Growth rate is inconsistent, so estimating around 20% seems fair. Even then, a multiple of 23 is high. A multiple of 20 would put fair value closer to $255.
Margins


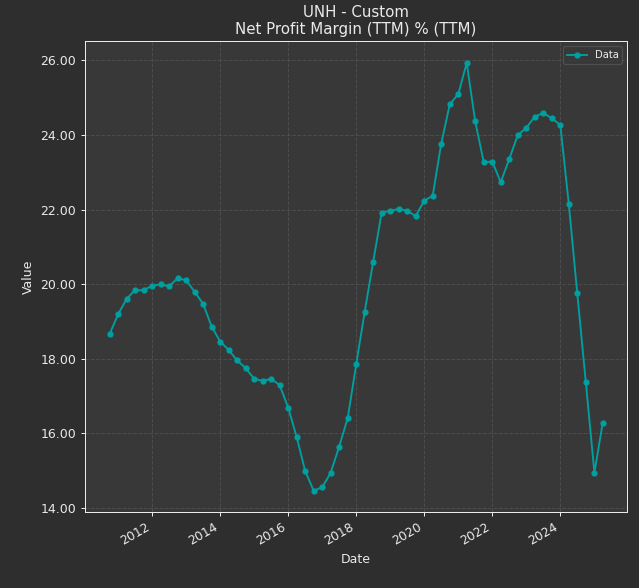
Why’d the margins go down?

Why? COGS is rising faster than revenue. Revenue grew ~8%, but COGS rose ~11–12%.
This is fully within management’s control. If Owner’s Earnings are your end-all metric, UNH still looks expensive compared to its past.
Call it -17% overvalued, conservatively.

1% Share Repurchases YoY for a long time.
CORRECTION

Thank you to User 8700nonK for suggesting that the Owner’s Earnings were wrong.
They were.
12.62 P/E
10.77 P/OE?