

USLM: United States Lime & Minerals
Dig Baby Dig.

What a move today. Is everything back to being overvalued? No – there’s always something compelling about USLM. If markets were perfectly efficient, we wouldn’t be discussing a stock like this.
Balance Sheet Strength

USLM boasts assets over 10 times its liabilities and current assets 8 times its liabilities. With a book value of 17.39 per share trading at 93.40, the P/B ratio comes in at 5.37. This strong balance sheet indicates that liquidity issues are unlikely to be a concern anytime soon.

Dilution

Before anyone mentions dilution, note that USLM reserves 167,000 of its 28 million shares outstanding for future compensation. Additionally, prior share splits were structured to lower the share price while awarding additional shares to existing shareholders, which minimizes any unintended dilution. This commitment to shareholder value means that the growth metrics we’re about to review aren’t being discounted by concerns about future dilution.
Growth Metrics

Line go up. What about its P/B ratio.
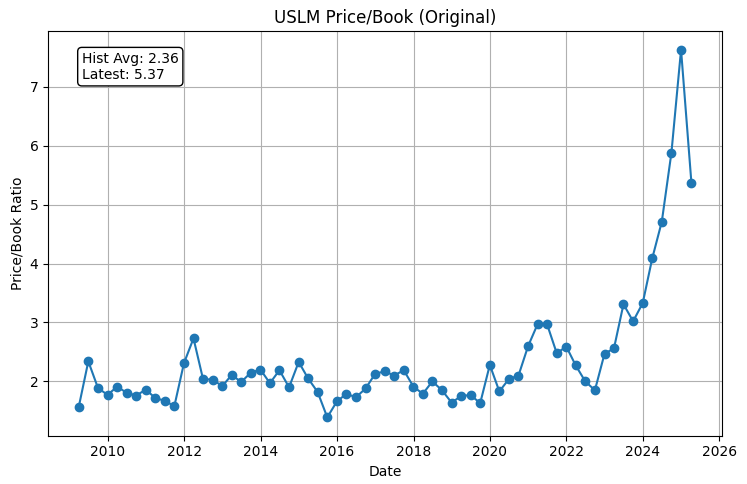
Book Value Growth (P/B Ratio)
Despite a P/B ratio of 5.37, USLM is pricing in roughly 5.37% growth.
The company has grown 26% year-over-year and achieved a 17.62% CAGR over the past five years.
This translates to PBG ratios of 0.20 for YoY growth and 0.30 for the 5-year period.

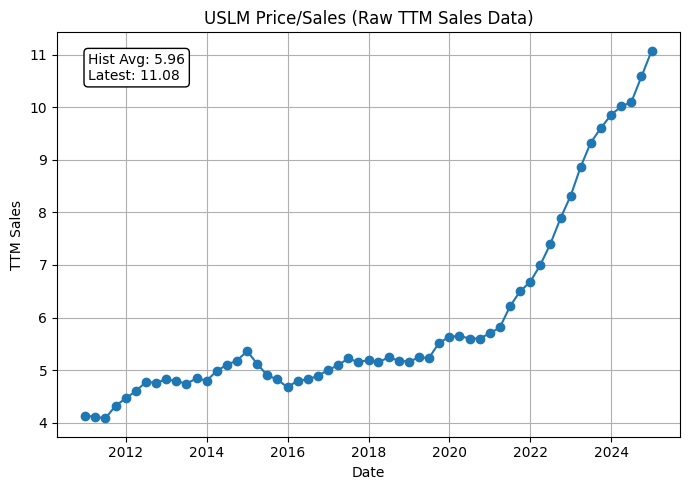
Sales Growth (P/S Ratio)
With a P/S ratio of 8.43, USLM has delivered 12.37% YoY sales growth and a 14.49% CAGR over five years.
The resulting growth ratios are 0.68 for YoY and 0.58 for the 5-year stretch.
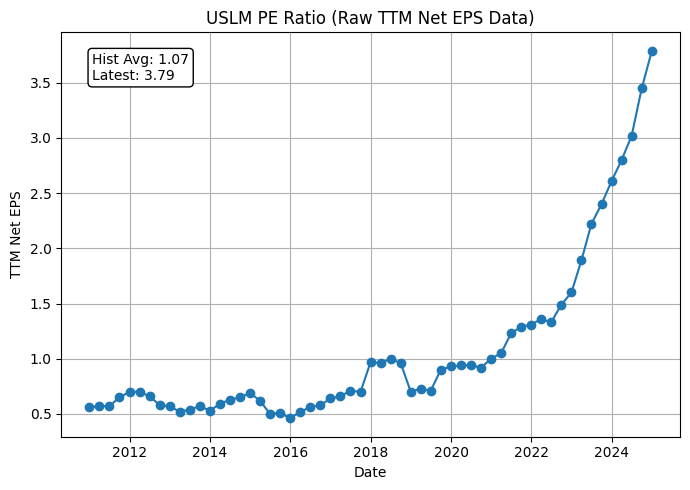

Earnings
The stock trades at a P/E of 25.
It has produced earnings growth of 45% year-over-year and a 5-year CAGR of 32%.
This corresponds to PEG ratios of 0.54 for 1-year earnings and 0.75 over 5 years.
Now for Free Cash Flow.

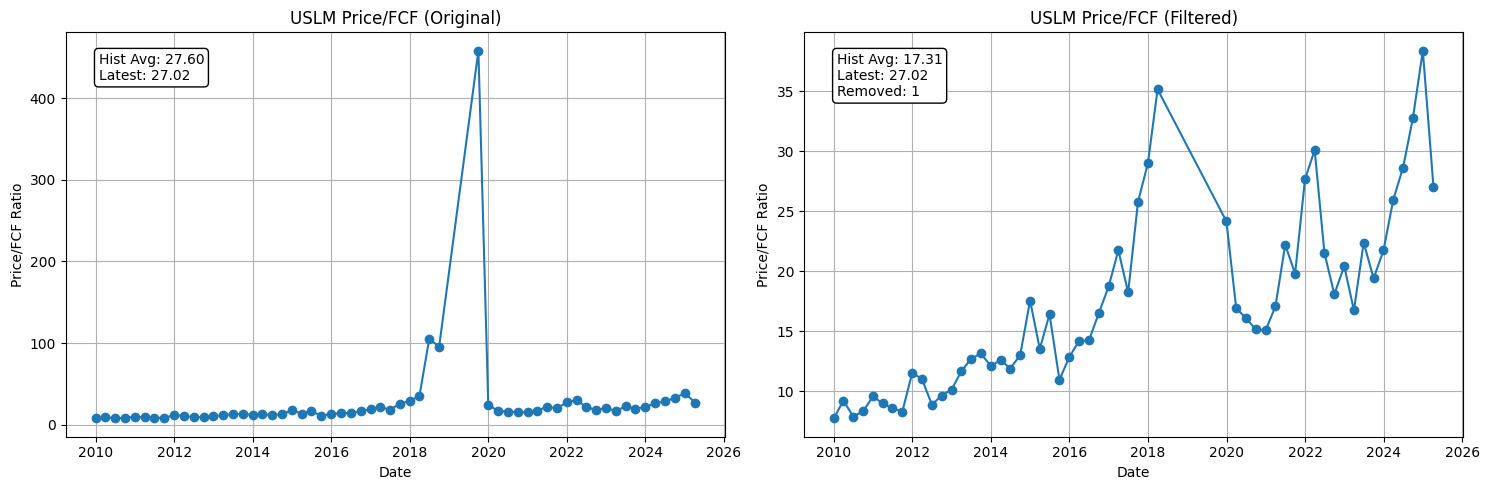
Free Cash Flow
USLM’s P/FCF ratio is 27.
The company has achieved 64% YoY growth in free cash flow and a 5-year CAGR of 36.5%.
These metrics give us PFCFG ratios of 0.42 for the 1-year period and 0.74 for the 5-year period.
Heres the Adjusted CapEx FCF Chart. For your curiosity.

Recap
• Ticker: USLM
– PEG Values:
• 1Y PEG: 0.544561
• 5Y PEG: 0.759211
– PSG Values:
• 1Y PSG: 0.68131
• 5Y PSG: 0.581626
– PFCFG Values:
• 1Y PFCFG: 0.422313
• 5Y PFCFG: 0.740513
– PBG Values:
• 1Y PBG: 0.204982
• 5Y PBG: 0.304644
5/5 Stars.
What they do
United States Lime & Minerals, Inc. is a leading manufacturer of lime and limestone products. The company mines high‑quality limestone from its extensive network of quarries and underground mines, primarily operating in states like Texas, Arkansas, and Oklahoma. It processes these natural resources into a variety of products—including crushed limestone, pulverized limestone (PLS), quicklime, hydrated lime, and lime slurry—that are essential to construction, industrial manufacturing, environmental treatment, and agriculture. The company serves a highly diversified customer base with approximately 675 customers, and no single customer accounted for more than 10% of its sales in 2024. This indicates that they do not have one largest buyer; rather, their sales are spread across various segments such as construction, industrial, environmental services, steel, and more, which helps mitigate the risks associated with customer concentration.
There you go.
